
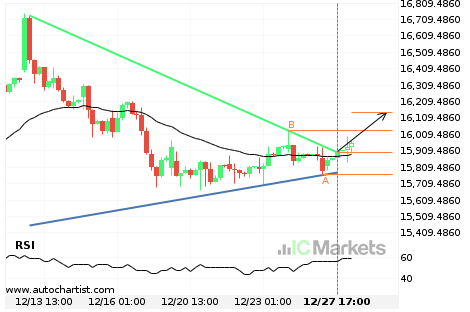
Possibility of big movement expected on FTSE China A50 Index
FTSE China A50 Index has broken through a resistance line of a Triangle and suggests a possible movement to 16144.0472 within the next 3 days. It has tested this line in the past, so one should probably wait for a confirmation of this breakout before taking action. If the breakout doesn’t confirm, we could see […]
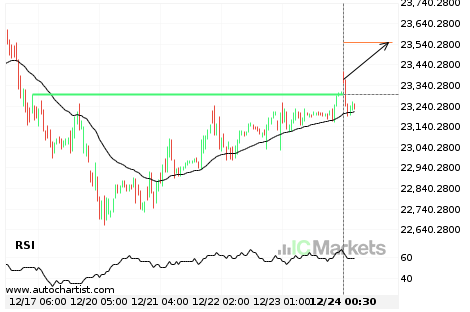
Should we expect a bullish trend on Hong Kong 50 Index?
The breakout of Hong Kong 50 Index through the 23295.3008 price line is a breach of an important psychological price that is has tested numerous in the past. If this breakout persists, Hong Kong 50 Index could test 23548.6992 within the next 14 hours. One should always be cautious before placing a trade, wait for […]

FTSE China A50 Index – getting close to psychological price line
FTSE China A50 Index is moving towards a support line. Because we have seen it retrace from this level in the past, we could see either a break through this line, or a rebound back to current levels. It has touched this line numerous times in the last 10 days and may test it again […]

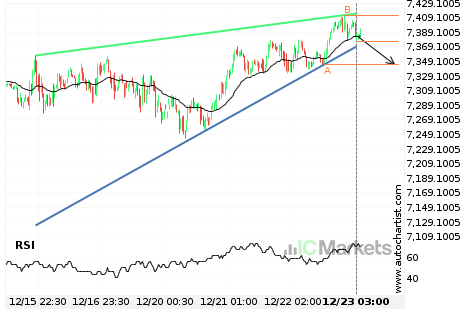
Should we expect a breakout or a rebound on Hong Kong 50 Index?
The movement of Hong Kong 50 Index towards 23757.8008 price line is yet another test of the line it reached numerous times in the past. We could expect this test to happen in the next 3 days, but it is uncertain whether it will result in a breakout through this line, or simply rebound back […]
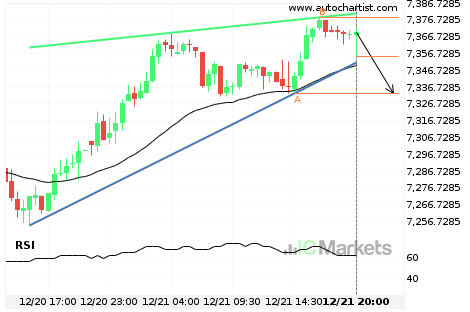
Australia 200 Index – getting close to support of a Rising Wedge
Australia 200 Index is moving towards a support line. Because we have seen it retrace from this line before, we could see either a break through this line, or a rebound back to current levels. It has touched this line numerous times in the last 8 days and may test it again within the next […]

Should we expect a bullish trend on Hong Kong 50 Index?
The breakout of Hong Kong 50 Index through the resistance line of a Channel Down could be a sign of the road ahead. If this breakout persists, we may see the price of Hong Kong 50 Index testing 23585.4321 within the next 2 days.

Should we expect a breakout or a rebound on Australia 200 Index?
The movement of Australia 200 Index towards the support line of a Rising Wedge is yet another test of the line it reached numerous times in the past. This line test could happen in the next 8 hours, but it is uncertain whether it will result in a breakout through this line, or simply rebound […]